Introspection
The Pipeline Inspector
There are two types of execution logs Kaspian displays for each Pipeline execution: execution and node-level logs.
Execution logs
The pipeline execution log presents any scheduler warnings or errors that resulted from starting up the pipeline. These are error logs produced by Kaspian if any errors occur while attempting to deploy the pipeline, e.g., the Git code path is invalid.

Clicking on the button under Execution Log will present the following modal:
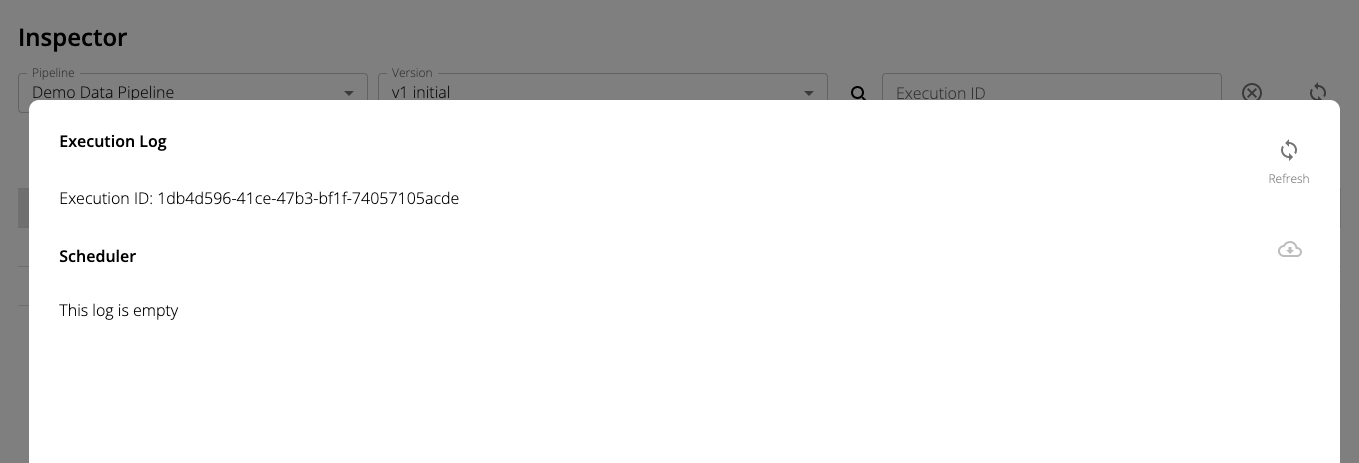
When there are no errors or warnings, the log will be empty.
Node logs
Once nodes in the Pipeline begin executing, they each have their own set of logs that can be displayed by clicking on the specific node and selecting the View Log button on the bottom righthand pane.
These contain the Spark logs produced during execution of each node.
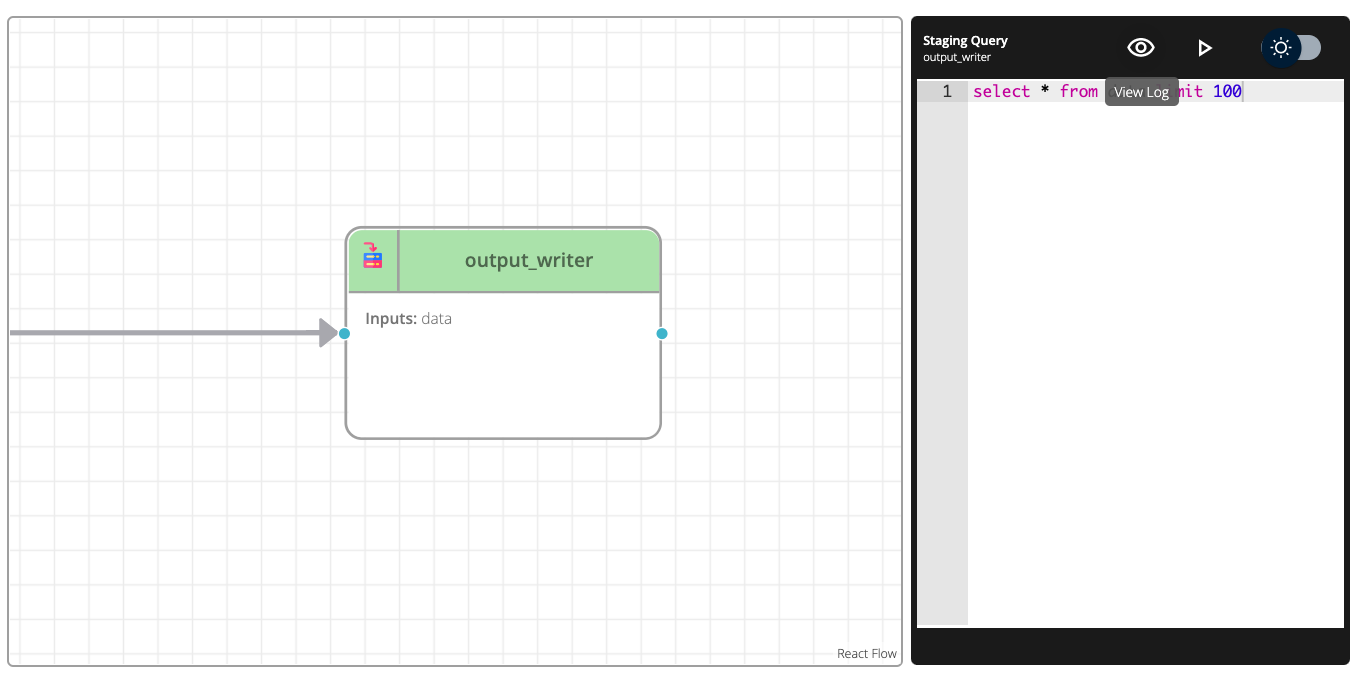
Clicking on this button will produce the following view:
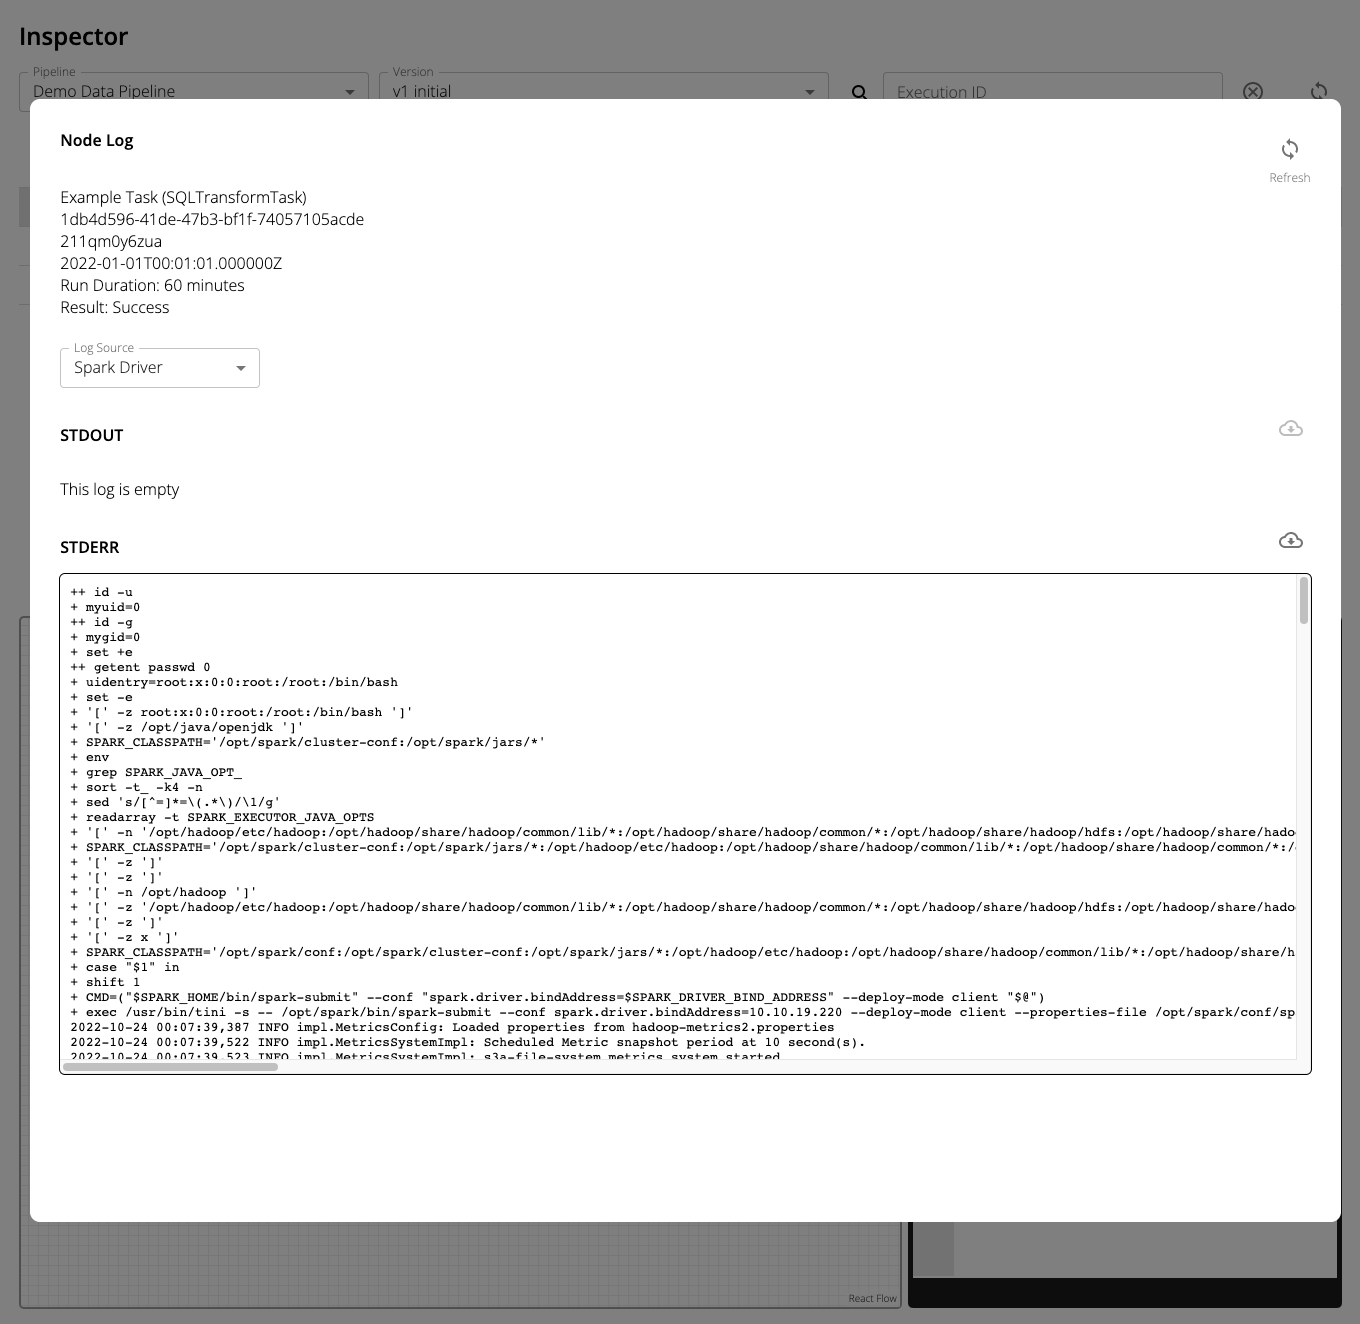
Here both STDOUT and STDERR streams are displayed for the Spark driver and executors.
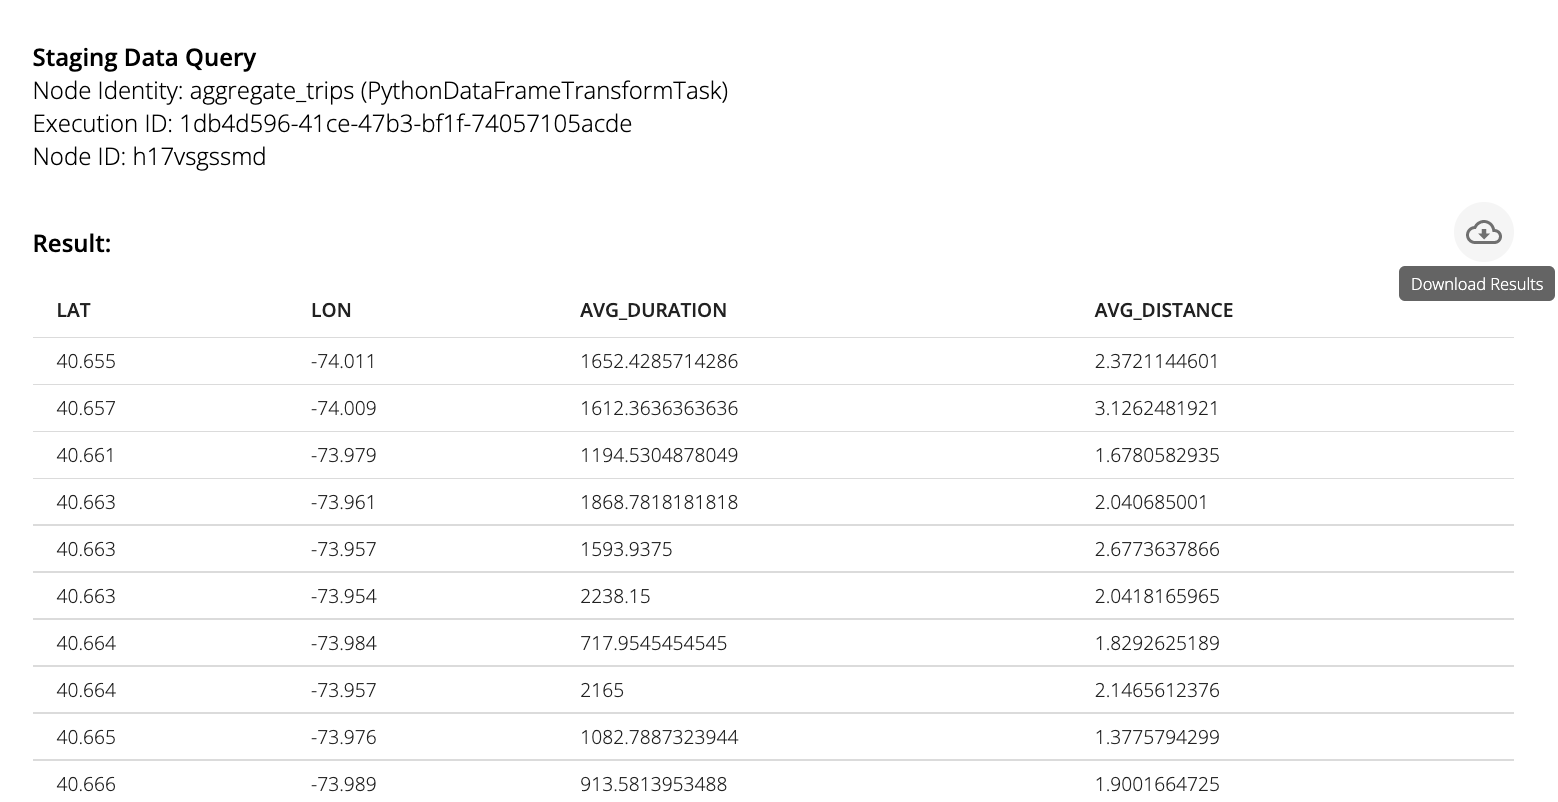
Query staging data
When a given node is clicked, the intermediate data that resulted from it during a given execution can be queried via a SQL console.
The output aliases (shown under Outputs in the node) for the specified task are used as the table names in the provided query.
For example
| |
To run the query, press the Play button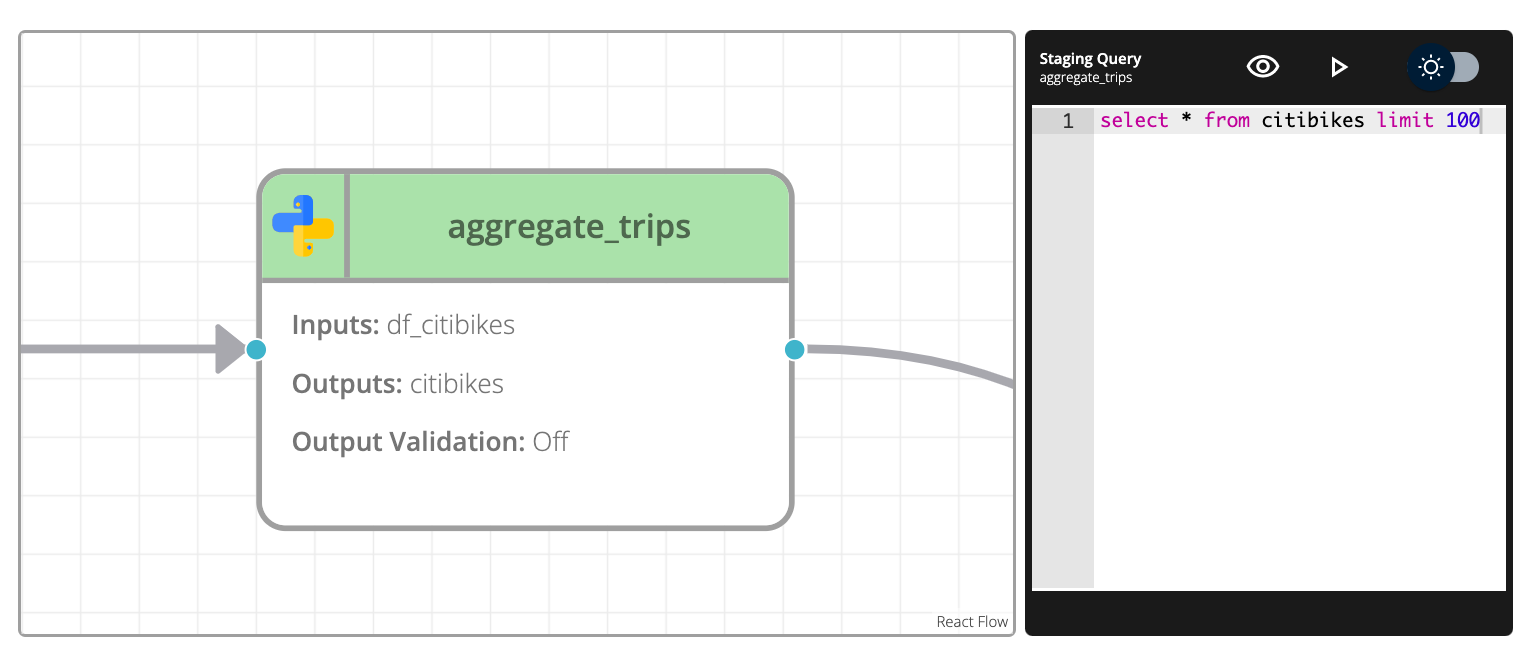
To keep the data volume manageable for the browser, the staging query console will truncate results to ~500MB. The resulting data can be downloaded from the table that pops up.
